• podcast
  • merch
  • blog
  • code
  • About
Menu

bright lights big data

a podcast about people, places, and data
  • podcast
  • merch
  • blog
  • code
  • About
A Full English Breakfast that I enjoyed at a little restaurant in Hampstead, London last spring.

A Full English Breakfast that I enjoyed at a little restaurant in Hampstead, London last spring.

Meal Planning for Nerds

April 5, 2017

When life gets busy, the first thing my husband and I drop is adequate meal planning. Dinners of pasta, frozen foods, takeout, or even breakfast cereal become frighteningly common. The last time we reflected on our regrettable habits, we recalled that we have tons of easy "go-to" recipes that we could be cooking. The problem lies in: 1) recalling such recipes when we're stressed out, and 2) picking a few and buying groceries for them.

As I type this, I'm feeling how pathetic it sounds... but that's where we are, folks. With my husband busy with professional projects and myself seven months pregnant, we are on the cusp of another Dark Age, culinarily speaking. We need a solution (and as soon-to-be parents, we should probably get this stuff figured out). 

Nerd that I am, my mind immediately went to writing some kind of program to handle all of this for us. (If you recall the Outfit-o-Tron 5000, you're probably not surprised) So, I decided to hone my R Shiny skills and build a simple application.

I slapped together a quick prototype and will be editing this post with updates as I add and refine features. Right now, it's pretty bare-bones, but the plan is to add support for ingredients and shopping-list building, and maybe even allow users to link to online recipes.

Link to the app is below. For the underlying code, check out my Github repo.

Plan your meals!
Tags shiny, programming, domestic life
Comment
“I wrote an algorithm” – Dr. Arnim Zola, Captain America: Winter SoldierImage: http://marvelcinematicuniverse.wikia.com/wiki/Arnim_ZolaNote: this blog is a participant in the Amazon Services LLC Associates Program, an affiliate advertising prog…

“I wrote an algorithm” – Dr. Arnim Zola, Captain America: Winter Soldier
Image: http://marvelcinematicuniverse.wikia.com/wiki/Arnim_Zola

Note: this blog is a participant in the Amazon Services LLC Associates Program, an affiliate advertising program designed to provide a means for me to earn fees by linking to Amazon.com and affiliated sites.

The Rise of the Evil Algorithm

March 28, 2017

In the age of Big Data, when Data Scientist has been named the “sexiest job of the 21st century”, perhaps it’s only natural that predictive analytics is beginning to replace the super-powered-laser as Hollywood villains’ evil weapon of choice. After all, the fundamental science behind each is a mystery to most people who have not studied them directly, and analytics is certainly more present in the public eye today.

I recall watching Captain America: Winter Soldier with my husband and (poorly) repressing my amusement at the characters’ reverent use of the word “algorithm”, as if that one word by itself spelled certain doom.

But what is an algorithm, really? Is it deserving of unequivocal fear?

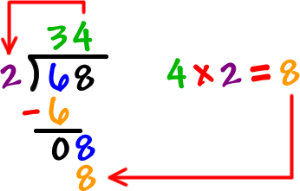
Elementary school children learn and use simple mathematical algorithms, such as long division.

Broadly speaking, an algorithm is a sequence of steps used to get something done. That definition could encompass everyday things like recipes and knitting patterns, as well as long division and neural networks. With such a broad range of algorithms, the word alone shouldn't immediately provoke fear. 

Cooking
Cooking

A recipe is a good example of an everyday algorithm. There are sequential steps, usually even with conditional logic thrown in (e.g. "cook until golden brown").

Long Division
Long Division

This is where some people would have started to hate algorithms, but is one of the simpler mathematical algorithms that is widely known.

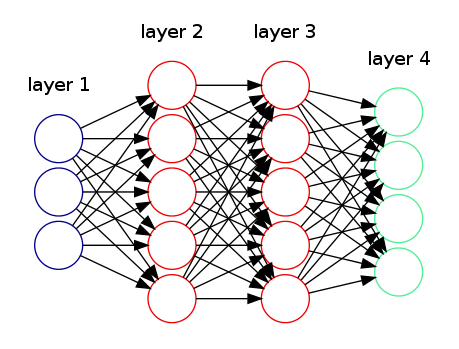
Neural Network
Neural Network

Neural networks are one of the most popular algorithms used by data scientists today, and they're so complex that their individual components are near-impossible to interpret in a business context. For the most part, they are accepted because they "just work".

But I hear you. Nobody is bragging about the new lemon ricotta pancake algorithm they tried over the weekend. The word "algorithm" typically applies to mathematical problem solving. But even mathematical algorithms don't have to be mysteriously complex processes that only data scientists can understand. Elementary school children learn and use simple mathematical algorithms, such as long division.

Complex algorithms could still theoretically be computed by hand, we just have machines perform them so we don't have to do millions of calculations on paper a la the human computers in Hidden Figures. So why does this term inspire equal parts awe and eyes-glazing-over?

As data science has advanced, so have the complexity and penetration of its algorithms. Statistical algorithms are being used to predict everything from what shoes you might want to buy on Amazon, to whether or not you're a key swing voter and what messaging you need to hear to vote for a given candidate.

Fans of House of Cards may recall a colorful character whose ... um... creative process ... my husband will never let me live down:

via GIPHY

"All that is necessary for evil to triumph is for good men to do nothing."

Some of these models, like the ones developed by Aidan MacAllan for the corrupt Underwood campaign, can have terrible (intended or unintended) consequences. Think predatory lending practices, or poorly designed employee performance evaluation models. In fact, data scientist Cathy O'Neil details many examples of such models in her recent book Weapons of Math Destruction. Although this book leans a little doom-and-gloom for my tastes, O'Neil does point out some common characteristics of what does make an algorithm "evil". As we've often heard before, "all that is necessary for evil to triumph is for good men to do nothing", and that is certainly the case here. 

One major factor in shady models is their lack of transparency to the public and/or the people they impact. Most companies consider their models to be intellectual property, and so they're unlikely to disclose the exact variables and coefficients used by the model to come to a particular solution. This lack of transparency is exacerbated by the general fear of algorithms we've already discussed: many people are intimidated by the very idea of statistics, and so they are reluctant to ask questions and unlikely to persist if given a hand-waving, convoluted answer. In essence, we do nothing to understand these models better, and allow evil to triumph.

Another major factor is the god-like status that analysts and companies give to their own models. Whether due to arrogance or laziness, some analysts treat models as infallible, not to be questioned. Unfortunately this usually means they are ill-equipped to explain the models because they haven't spent much time thinking about them from an outsider's perspective. Furthermore, they're less likely (according to O'Neil) to thoroughly analyze the model's performance after it's put into production. They may measure whether profits increased as expected (although even this is shockingly rare according to some industry articles I've read), but they probably aren't checking to see whether profits could have increased further with a different decision. Once the model is in place, the analysts do nothing and evil triumphs.

"All models are wrong, but some are useful."

Models are never infallible. We're often given the impression that really smart people program computers such that the ideal answer just emerges on its own like a butterfly from a chrysalis, but that's not even remotely the case. Human beings make decisions about what variables to allow the model to consider, and that alone can lead to oversight or implicit bias in the model. A former classmate reminded me today of a great quote by statistician George Box: "all models are wrong, but some are useful." Even the best model will occasionally predict the wrong outcome. Sometimes Amazon will advertise $40,000 watches to me when I'm logged in. Historically well-performing election predictions sometimes confidently back a losing candidate. The job of the analyst is to choose the model that gets it right most frequently, or earns the most money, or does the least harm. The job of everyone else in the age of Big Data is to be a savvy consumer, unafraid to ask questions.

So don’t let the unknown become frightening, and don’t let the word “algorithm” end the conversation. Ask questions, especially when models hit closer to home, such as the workplace and your child's school district:

  • What factors are important? (Age, sex, income, etc)
  • How are customized factors defined? (e.g. "Performance Rating")
  • How precise are the model's predictions, vs. how precisely decisions are being used? (does the model predict within +/- 5 points but you're not given +/- 5 points' benefit of the doubt?)

These are all questions that decision makers should be able to answer in relatively simple terms when speaking generally about a model, and that they would need to understand in order to describe why an individual decision was made (e.g. why you're not getting a raise this year). You may be surprised by how simple these foreboding models actually are. If, however, the people in power can't answer those questions, they're giving models a god-like status, just like Arnim Zola and Natasha Romanoff did. And that's certainly something to fear.
Comment

Debate Sentiment

October 20, 2016

We made it, you guys. Three presidential debates and we're all still standing. I don't know about you, but I am emotionally exhausted by this election, and particularly the debate performances. These debates have felt like a far cry from respectful, intellectual debate, and have each seemed to devolve into negativity and, at times, immaturity. In such a polarizing election cycle, however, it's difficult to separate one's own opinions about a candidate from his or her actual performance. As an analyst, I like to find ways to mitigate my biases - and believe me, I am quite biased this year. I decided to turn to - what else? - the data.

Sentiment Scoring

Sentiment analysis essentially checks a piece of text against a library of terms which are associated with some type and strength of emotion. There are several different types of sentiment models. The one I'm using assigns a value for how positive or negative a piece of text is. These methods are sufficiently complex to assign a positive score to "I'm happy" (0.71) and a negative score to "I'm not happy" (-0.58). The score is weighted by the total number of words in the text, so a short positive phrase will score higher than a lengthy positive phrase: "I'm a happy person" scores 0.5. 

A more relevant example: "make America great again" produces a score of 0.5, whereas the phrase "stronger together" scores about 0.71. As we shall soon see, this performance of campaign slogans is just the beginning.

Debate by Debate

If we analyze a debate's sentiment by each "turn" of talk, or each segment before another participant begins speaking, we can paint a picture of the emotional progression of the debate. 

First Debate

Color indicates debate participant (red for Trump, blue for Clinton, and black for moderator Holt). Size indicates how many words were spoken in the turn.

Color indicates debate participant (red for Trump, blue for Clinton, and black for moderator Holt). Size indicates how many words were spoken in the turn.

Here we see a large black dot for Holt's optimistic introduction, followed by Clinton's positive opening statement, and Trump's slightly less positive opening statement. Then we quickly start to get all over the board, with Trump showing the first dip into negative territory. And about halfway through the debate we start to see Trump's interjections of "wrong", which score -1 each. With two exceptions, Trump has the monopoly on turns scoring -0.5 or less. Conversely, Clinton was responsible for all but one +0.5 turn, and she generally seemed to be staying on the positive or neutral side. She seems to have lived up to her beloved Michelle Obama quote, "when they go low, you go high."

Second Debate

To me, this graph reveals a concerted effort from Trump to be on his best behavior. Early in the debate he had some fairly positive statements, and even had the highest scoring turn of the debate. The highest and lowest scores here are better than in the first debate, although Trump can be seen once again regressing in the second half of the debate.

Clinton, for her part, appears to have maintained her first debate performance, although she came out of the gate with a much more positive opening response to the first town hall question.

Interestingly, the moderator participation - which could be questions, follow-ups, or candidate-cat-herding - in the second debate shows a lot of quite positive turns, whereas in the first debate we saw more negatives.

Third Debate

And here we go again. Just a quarter of the way through the debate, we see Trump starting to return to the negative, short interjections. As an observer, this debate felt like the most contentious of all three, and I think that's proved out in the data by how un-crowded the neutral area is here. There's a lot more daylight in between the dots along the zero line. Clinton, although not as negative as Trump, was definitely less positive than in her first two performances.

Moderator participation looks a bit different in this debate, with a few large black dots clustered closely together toward the beginning and end.

Overall Performance

The scatterplots are interesting for us to see extreme behaviors and a little bit of trend within a single debate, but it's difficult to completely summarize how each participant came across in the debates overall. Therefore, we turn to the following bar graph, which compares each candidate (and moderator's) debate-average sentiment scores.

Numeric bar labels indicate how many sentences were spoken by the participant.

Numeric bar labels indicate how many sentences were spoken by the participant.

As we can see, Clinton's overall performance (the average sentiment of each of her sentences) was somewhat positive in the first debate and even more so in the second, but dipped to her least positive for the third. Trump, on the other hand, was quite close to neutral and then dipped firmly into negative territory for the second debate, and recovered slightly for the final. Trump also consistently used more sentences than Clinton, according to the transcripts. And this is not just due to short interjections like those seen so memorably in the first and final debates: Trump used 1,000-2,000 more words than Clinton in the first two debates. That gap shrunk debate by debate until finally they were almost exactly equal: 6,464 words for Trump to Clinton's 6,462.

I had assumed the debate moderators would appear the most neutral among the participants, and was surprised to see this was not the case. In particular, the town hall participants (labeled "Question") appear very positive. A lot of this is due to the low number of sentences from this group, which leaves less room for neutral, filler-type phrases. Also, kudos to Cooper and Raddatz for co-moderating on such equal footing: 144 sentences each. 

In cases of sentiment, it's fun to look at the extremes. Despite being the less positive candidate in the first debate, Trump had the most positive sentence and Clinton had the most negative. This flipped in the second debate, and then Trump took both extremes in the final. You can find the phrases and other info in the table below.

First Debate
Second Debate
Third Debate
Most Positive Sentence These are very fine institutions, very fine banks. Well, I certainly will, because I think that's a very fair and important question. I am a very strong supporter of the second amendment.
    Score 1.27 1.66 1.14
    Speaker Trump Clinton Trump
Most Negative Sentence Slashing taxes on the wealthy hasn't worked. It's very bad, very bad health insurance. She's guilty of a very, very serious crime.
    Score -1.13 -1.66 -1.47
    Speaker Clinton Trump Trump
Trump Word Count 8,659 7,364 6,464
Clinton Word Count 6,422 6,290 6,462
Moderator Word Count 1,918 2,553 3,286

I find the word count trends particularly interesting here. All three debates had between 16,000 and 17,000 words total, but the distribution changed dramatically over time, with Trump's initial dominance fading in subsequent debates as moderators participated more and more.

There you have it, folks. I hope this analysis helped bring some order to the chaos of it all. This will likely conclude any and all election coverage on this blog as I move on to areas that don't stress me out quite as much.

Here, have a kitten. I think we both need it.

Our cat Auri, the day we adopted her at three months.

Our cat Auri, the day we adopted her at three months.


2 Comments
Older Posts →

Latest Posts

Featured
Aug 9, 2021
BLBD 57: How Train Go?
Aug 9, 2021
Aug 9, 2021
Jul 26, 2021
BLBD 56: Hodgepodge
Jul 26, 2021
Jul 26, 2021
Jul 12, 2021
BLBD 55: Book Lights, Big Words
Jul 12, 2021
Jul 12, 2021
Jun 28, 2021
BLBD 54: I'm the MAAAAP!
Jun 28, 2021
Jun 28, 2021
Jun 14, 2021
BLBD 53: Flip for it
Jun 14, 2021
Jun 14, 2021
May 31, 2021
BLBD 52: Board Games
May 31, 2021
May 31, 2021
May 17, 2021
BLBD 51: I know jack about cities
May 17, 2021
May 17, 2021
May 3, 2021
BLBD 50: Shorter countertops now!
May 3, 2021
May 3, 2021
Sep 7, 2020
BLBD 49: Fear and Loathing in Midgar
Sep 7, 2020
Sep 7, 2020
Apr 22, 2020
BLBD 48: Nasty Times
Apr 22, 2020
Apr 22, 2020

© Copyright 2014-2020 Tammy and Mike Armstrong